Option Greeks
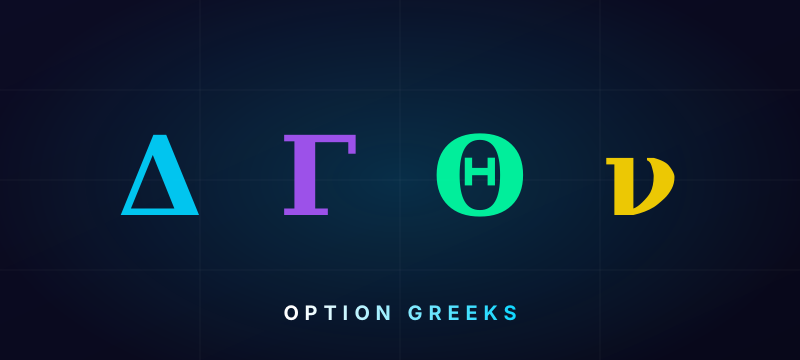
Options Greeks Explained — What Every Trader Needs to Know
Delta, Gamma, Vega, Theta, Vanna, and Charm — what each Greek measures, why it matters, and how dealer positioning around them drives intraday price behavior.
Read →
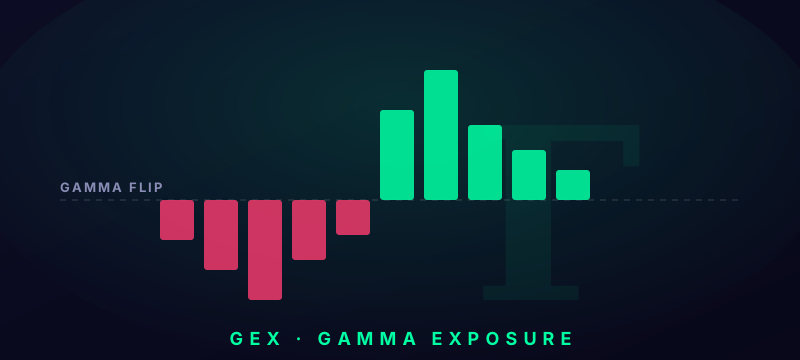
GEX Explained — How Gamma Exposure Drives Intraday Price Behavior
GEX (Gamma Exposure) reveals whether dealers are amplifying or dampening market moves. Learn what positive and negative GEX mean, where the gamma flip sits, and how to use GEX levels as intraday reference points.
Read →

VEX Explained — How Vanna Exposure Shapes Volatility-Driven Moves
VEX (Vanna Exposure) tracks how dealer delta hedging responds to changes in implied volatility. When IV spikes or collapses, vanna flows create real buying and selling pressure — independent of any directional move.
Read →
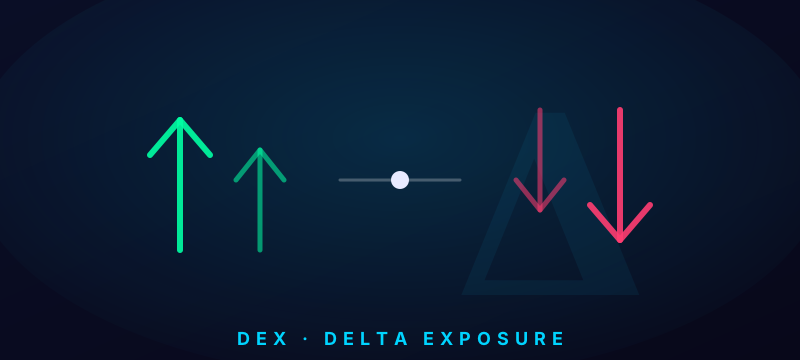
DEX Explained — Understanding Delta Exposure and Directional Dealer Flow
DEX (Delta Exposure) shows the net directional position dealers hold across all open options contracts. Unlike GEX which governs volatility regime, DEX reveals the underlying directional tilt baked into the options market.
Read →
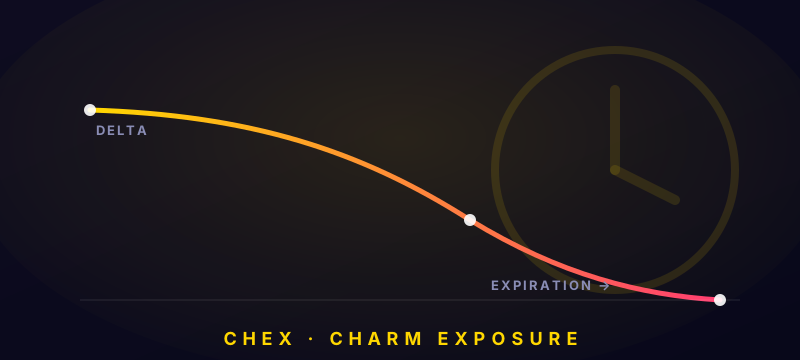
CHEX Explained — How Charm Drives End-of-Day and Expiration Moves
CHEX (Charm Exposure) tracks how dealer delta changes over time as options approach expiration. Charm flows are strongest on Fridays and in the final hours of trading — and they explain many of the "unexplained" drifts and pins traders observe near the close.
Read →
Tools & Platform
◈
The gammaflowpulse Dashboard — A Quick-Start Guide
A walkthrough of the gammaflowpulse dashboard — how to navigate it, switch tickers, understand the header data, and know which tabs are available at your tier.
Read →
◈
Live Charts — Reading Price Action Through the Lens of GEX Levels(beta)
The Live Charts tab overlays real-time GEX levels onto a candlestick price chart, so you can see exactly how price interacts with gamma flip, call wall, put wall, and key strike levels throughout the session.
Read →