What the Live Charts Tab Shows
The Live Charts tab combines two things that are usually kept separate — price action and dealer positioning levels — onto a single chart.
The candlestick chart plots intraday OHLC price data for the selected ticker. Overlaid on top are the current GEX-derived levels:
- Gamma flip — the level where dealer hedging behavior switches regime
- Call wall — the strike with peak positive gamma from calls
- Put wall — the strike with peak negative gamma from puts
- Spot GEX level — a dynamic band showing the current gamma concentration around the spot price
These levels update as the options chain snapshot refreshes, so you see in real time when a key level shifts (for example, when a large open interest position expires intraday or a new strike becomes dominant).
Why Overlay GEX Levels on Price?
Standard technical analysis draws support and resistance from past price behavior — prior highs, lows, moving averages. GEX levels are different: they are forward-looking structural levels derived from where dealers must hedge today.
When price approaches the call wall, you are not just approaching a prior high — you are approaching the level where dealer selling pressure is mechanically highest right now. When price breaks below the gamma flip, you are not just breaking a trendline — you are watching a regime change in real time.
Combining both on one chart gives you context that neither can provide alone.
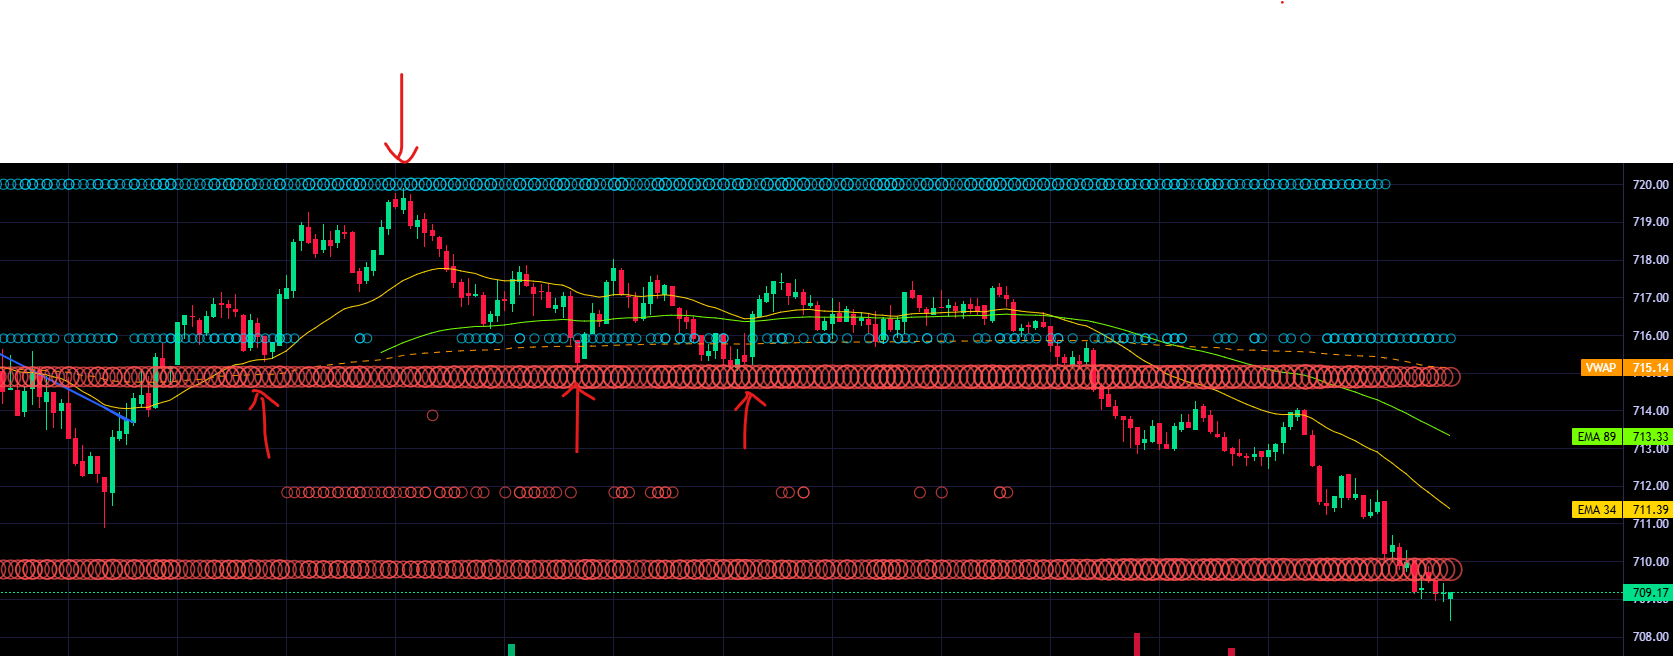
Example from 6-24-2026 for QQQ.
The top positive GEX level for the day was 720, while 715 and 710 were the top two negative GEX levels, with 715 acting as the primary negative GEX zone. As shown in the screenshot, QQQ bounced early without touching 710, then retested 715 on the way up before pushing toward 720.
The 720 positive GEX level acted as resistance, causing price to stall and reverse. Meanwhile, 715 provided solid support for several hours until it eventually broke later in the day.
Example from 07/02/2026 for QQQ
The top two positive GEX levels five minutes after the market opened were 730 and 735. Because it was non‑farm payroll day—which often leans bearish—the early price action mattered even more. On the 5‑minute chart, QQQ printed an indecision candle and then retested the 730 GEX level, while SPY retested its HOD. Together, that created a clean short‑setup zone. The GEX chart below illustrates the confluence clearly.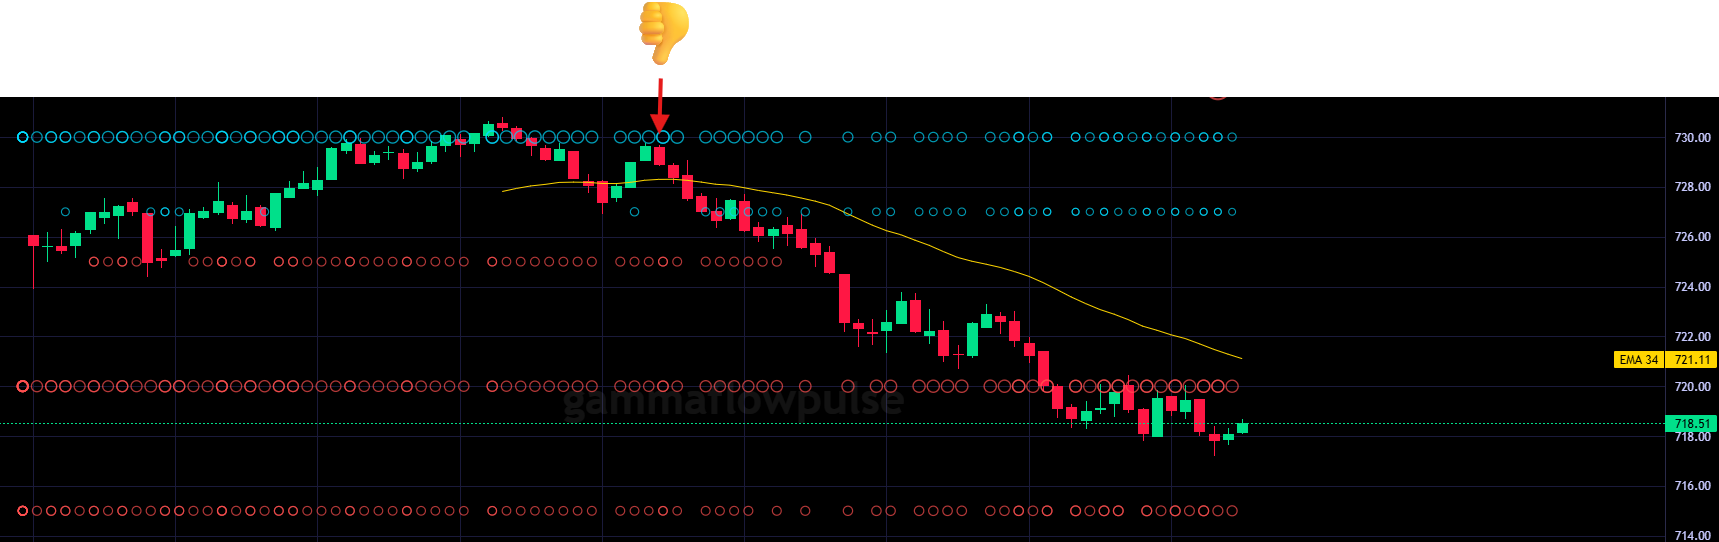
Reading the Key Levels
Gamma Flip
Plotted as a horizontal line across the chart. Watch how price behaves around it:
- Price spending time above the flip and bouncing = positive GEX regime holding, fade moves
- Price breaking below and staying below = regime has shifted, expect larger moves
- Repeated tests of the flip without a clean break = indecision, wait for resolution before committing
Call Wall
The upper boundary of the expected range. Price approaching the call wall from below often stalls — not always, but the structural selling pressure is real. In a strong positive GEX environment, the call wall acts as a ceiling for the session. In a negative GEX environment, a clean break through the call wall can trigger rapid acceleration as dealers chase.
Put Wall
The lower boundary. In positive GEX, price bouncing off the put wall is common — dealer buying flows support it. A clean break below the put wall in negative GEX can accelerate quickly as dealers add to selling.
The Range
Between the call wall and put wall is the dealer-defined expected range. Strategies change depending on whether price is inside or outside this range:
- Inside the range, positive GEX → fade moves toward the walls
- Outside the range, negative GEX → follow the move, the structure has broken down
Intraday Level Shifts
Unlike static technical levels, GEX levels can shift during the session. Watch for:
Call wall shift upward — large open interest has rolled up or new call buying has created a new peak. The range has expanded to the upside.
Gamma flip moving — can happen when a strike with large gamma passes through spot price, or when options flow significantly changes the composition of the open interest. A flip that was at 5,000 may move to 4,980 after a large block trade.
Put wall collapsing — if open interest at the put wall expires or is closed, the structural support disappears. This is often a warning sign if price is testing that level.
The Live Charts tab shows the current levels — compare them mentally to where they opened the session to spot shifts.
Practical Live Charts Workflow
Pre-market setup
Before the open, note where the gamma flip, call wall, and put wall are sitting relative to overnight price. This defines your expected range for the session.
At the open
Watch where price opens relative to the gamma flip. Gap above it and hold? Positive GEX regime is intact — fade early volatility. Gap below and fail to reclaim? Negative regime — expect directional follow-through.
Intraday
Use the GEX levels as decision zones rather than precise lines. When price enters the zone around the call wall, tighten targets if you are long. When price approaches the put wall, watch for a bounce — or a break with acceleration.
Into the close
Check whether price is gravitating toward a specific strike with large open interest. Combined with the CHEX map, this helps identify where the expiration pin target is on a Friday.