Getting Oriented
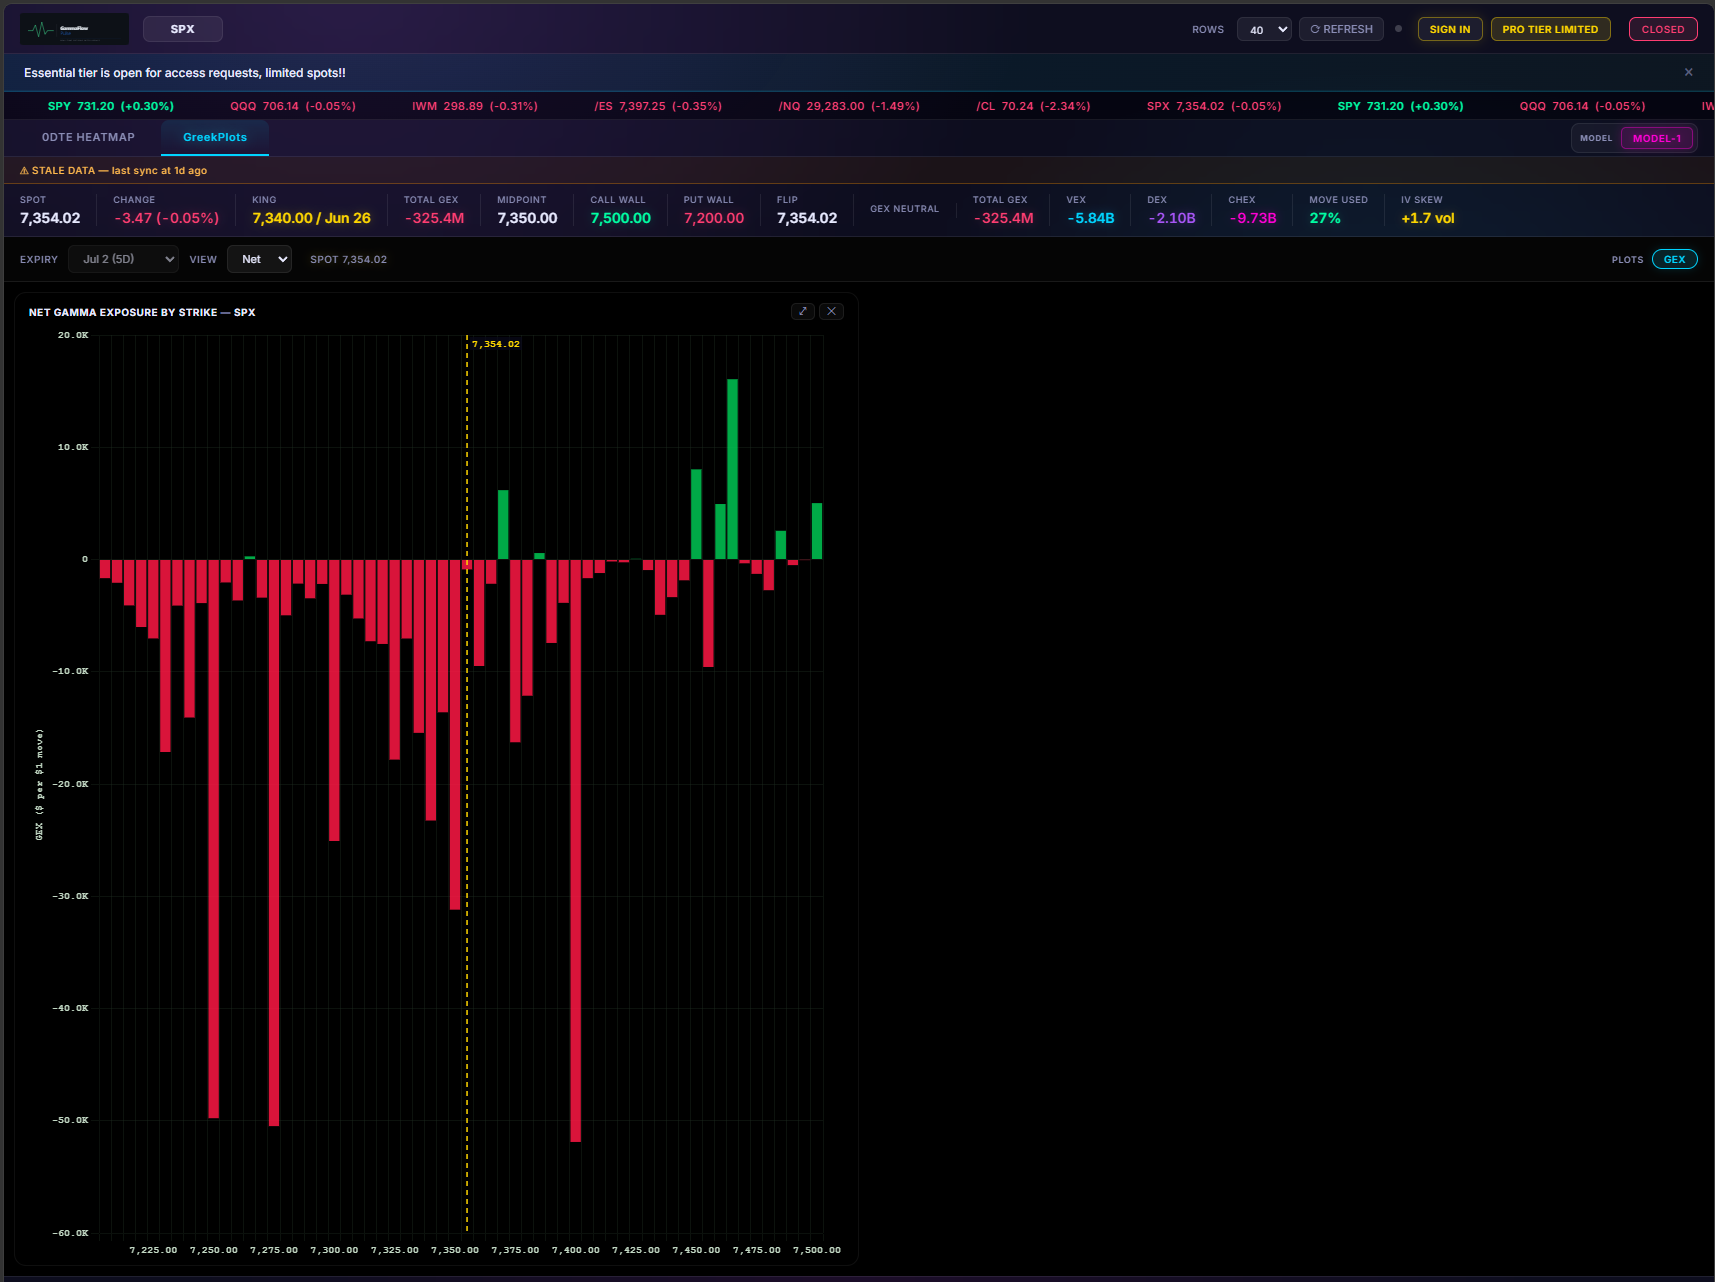
When you log in, the dashboard loads your default ticker and begins fetching live dealer-positioning data. Everything on the page updates automatically — you do not need to refresh manually.
The dashboard is organized into three zones:
- Header — ticker selector, market status, and key live metrics
- Tabs — the main analysis views (Charts, GreekPlots, 0DTE Heatmap, Signals, and more)
- Ticker banner — scrolling quote bar for watchlist tickers
The Header
The header shows the most critical live numbers at a glance.
Ticker selector
Type any supported ticker in the search box or use the arrow buttons to cycle through your watchlist. Starred tickers are pinned to the front of your list. The active ticker drives all charts and data on the page.
Market status
Shows whether the market is currently OPEN, PRE-MARKET, or CLOSED. Data polling runs continuously during market hours. Outside of hours, the last captured snapshot remains on screen.
Key metrics
Depending on your tier, the header displays live spot price, total GEX, the gamma flip level, call wall, put wall, and expected move. These are derived from the most recent options chain snapshot — typically updated every 15–30 seconds for priority tickers like SPX and SPY.
Switching Tickers
Click the ticker input and type to search. As you type, the dropdown filters to matching symbols. Select a ticker or press Enter to load it.
Favorites (starred tickers) appear at the top of the dropdown and as quick-access pins in the header. Click the star next to any ticker in the dropdown to add or remove it from your favorites.
Free tier: SPX, SPY, and QQQ are available. All other tickers require Essential tier or above.
The Tab System
Tabs run across the top of the main content area. Click any tab to switch views — the active tab is highlighted.
Free tier tabs:
- Charts — GEX profile chart with key levels (gamma flip, call wall, put wall)
- 0DTE Heatmap — zero-days-to-expiration gamma distribution by strike and time
Essential tier adds:
- GreekPlots — VEX, DEX, and CHEX exposure by strike
- Live Charts — candlestick price chart with GEX levels overlaid
- Additional intraday views
Pro and Max tiers unlock the full tab set including Signals, advanced detectors, historical rewind, and flow data.
Reading the Data — Key Principles
Snapshots, not streaming
gammaflowpulse pulls options chain data at regular intervals and processes it into positioning maps. The maps reflect the state of the chain at the last snapshot — not a real-time tick feed. For SPX, this is typically every 15 seconds during market hours.
Dealer perspective, not retail
Every number on the dashboard represents what dealers are doing — not what retail traders are buying. GEX, VEX, DEX, and CHEX are all calculated from the dealer's hedging obligation, which is the mirror image of what the options buyer holds.
Levels are ranges, not lines
A gamma flip shown at 5,020 does not mean 5,020 is a hard wall. It is the center of a zone where dealer behavior shifts. Price can oscillate around it before committing to one side.
Tips for New Users
- Start with GEX — check whether you are in a positive or negative gamma environment before looking at anything else. This sets your volatility expectation for the session.
- Note the gamma flip — is price above or below it? This tells you whether dealer flows are dampening or amplifying moves.
- Check call wall and put wall — these define the expected range. Trading between them is very different from trading outside them.
- Use the ticker banner — glance at it periodically to see which of your watchlist tickers are moving. Click any ticker in the banner to switch the dashboard to that symbol instantly.